The first production incident I ever debugged without metrics took four hours. The same class of incident, a year later with Prometheus and Grafana in place, took eleven minutes — most of which was me making tea while the dashboard confirmed what the alert had already told me. That difference is not about tooling sophistication. It's about having the right handful of numbers on a graph before you need them.
The trap most teams fall into is the opposite one: instrumenting everything, graphing everything, alerting on everything, and then ignoring all of it because 95% of it is noise. This post is the setup I actually run for Node.js backends — which metrics matter, how to expose them from NestJS with prom-client, what to build in Grafana, and how to write alerts that you'll still trust six months from now.
The metrics that actually matter
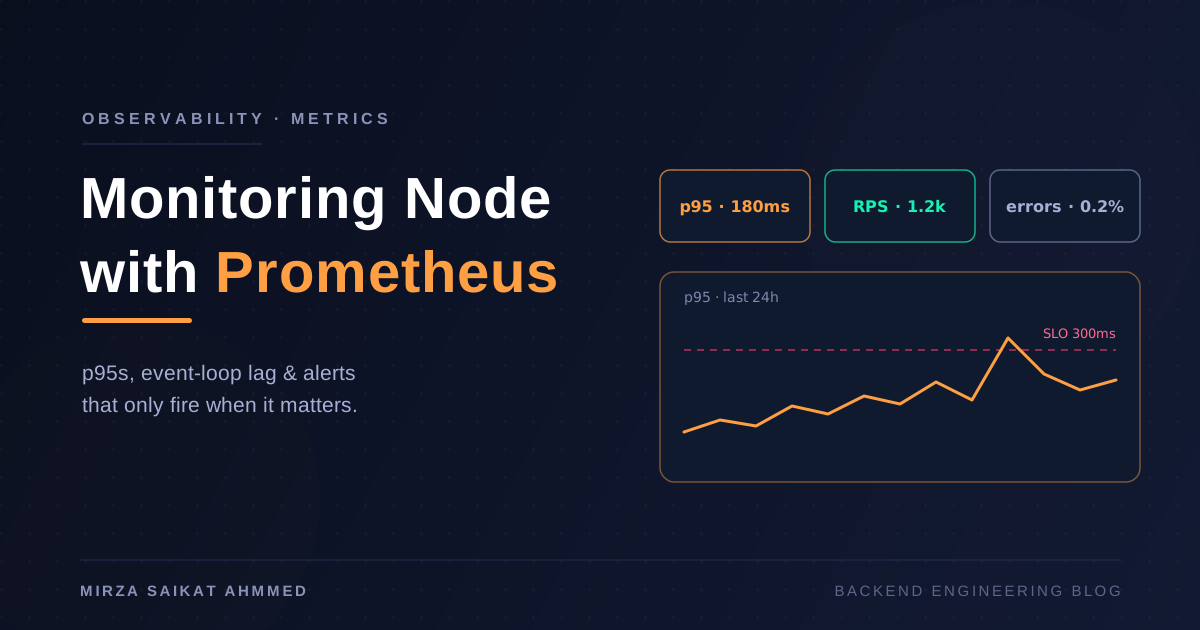
For request-serving backends I start with the RED method: for every service (and every important endpoint), track Rate (requests per second), Errors (failed requests per second), and Duration (how long requests take). Those three answer the only question that matters at 3 a.m.: are users having a bad time, and how bad?
Two rules make RED useful instead of decorative:
Percentiles, not averages. An average latency of 90ms can hide a p99 of 4 seconds. Averages are what your service does for nobody in particular; percentiles are what it does for actual users. I look at p50 (typical experience), p95 (the unlucky-but-common case), and p99 (the tail that times out and retries). If your p95 doubles while your average barely moves, you have a real problem that the average just lied to you about.
Node-specific vitals. Because Node.js is single-threaded per process, a few runtime metrics predict trouble before requests start failing:
- Event-loop lag. If the loop is blocked — a synchronous JSON parse of a huge payload, a hot regex, an accidental
fs.readFileSync— every request on that process stalls. Sustained lag above ~50–100ms is my earliest warning signal, and it fires before latency percentiles visibly degrade. - Heap usage and GC. A slow upward drift in
nodejs_heap_size_used_bytesacross days is a leak; sawtooth patterns are normal. Rising GC pause time shows up as mysterious latency jitter that no amount of query optimization will fix. - DB pool saturation. The classic hidden bottleneck. Your Postgres box is at 20% CPU, your service is "slow", and the actual cause is 10 pool connections with 40 requests queueing for them. Track connections in use vs. pool size, and queue wait time if your driver exposes it.
Everything else — cache hit rates, queue depths, per-dependency latency — I add when a specific incident proves I need it, not before.
Exposing /metrics from NestJS with prom-client
prom-client is the standard Prometheus client for Node. The default metrics alone (heap, GC, event-loop lag, CPU) are worth the install:
// metrics.module.ts
import { Module } from '@nestjs/common';
import { collectDefaultMetrics, Registry } from 'prom-client';

export const registry = new Registry();
collectDefaultMetrics({ register: registry }); // heap, GC, event loop lag, CPU

@Module({})
export class MetricsModule {}
For RED metrics, one histogram does almost all the work. A Prometheus histogram counts observations into buckets, which means the server can compute any percentile later — but only as precisely as your bucket boundaries allow, so choose them around your SLO rather than accepting the defaults:
// http-metrics.interceptor.ts
import { Injectable, NestInterceptor, ExecutionContext, CallHandler } from '@nestjs/common';
import { Histogram } from 'prom-client';
import { Observable } from 'rxjs';
import { tap } from 'rxjs/operators';
import { registry } from './metrics.module';

const httpDuration = new Histogram({
  name: 'http_request_duration_seconds',
  help: 'HTTP request duration in seconds',
  labelNames: ['method', 'route', 'status'],
  // Buckets bracket the SLO (say, 300ms) tightly where precision matters
  buckets: [0.025, 0.05, 0.1, 0.2, 0.3, 0.5, 1, 2.5, 5, 10],
  registers: [registry],
});

@Injectable()
export class HttpMetricsInterceptor implements NestInterceptor {
  intercept(ctx: ExecutionContext, next: CallHandler): Observable<unknown> {
    const req = ctx.switchToHttp().getRequest();
    const route = req.route?.path ?? 'unknown'; // the pattern, NOT the raw URL
    const end = httpDuration.startTimer({ method: req.method, route });

    return next.handle().pipe(
      tap({
        next: () => end({ status: ctx.switchToHttp().getResponse().statusCode }),
        error: (err) => end({ status: err?.status ?? 500 }),
      }),
    );
  }
}
The one mistake to avoid here is label cardinality. Labels multiply time series: use the route pattern (/users/:id), never the raw URL (/users/48213), and never put user IDs, emails, or request IDs in labels. I've watched a Prometheus instance eat 8GB of RAM because someone labeled a counter with a session token.
Then a controller serves the registry:
@Controller('metrics')
export class MetricsController {
  @Get()
  @Header('Content-Type', registry.contentType)
  getMetrics(): Promise<string> {
    return registry.metrics();
  }
}
One caveat if you followed my NestJS microservices setup: each service needs its own /metrics endpoint and its own scrape target — Prometheus aggregates across services at query time, you don't aggregate at collection time. And if your internal hops are gRPC rather than HTTP (the trade-offs are in HTTP vs gRPC), the same histogram pattern applies via a gRPC interceptor — the metric name changes, the buckets logic doesn't.
Pointing Prometheus at it
Prometheus pulls, it isn't pushed to — which means a dead service shows up as a failed scrape (up == 0) instead of silence. The config is short:
# prometheus.yml
global:
  scrape_interval: 15s
  evaluation_interval: 15s

rule_files:
  - /etc/prometheus/alerts.yml

scrape_configs:
  - job_name: "api"
    static_configs:
      - targets: ["api:3000"]
  - job_name: "worker"
    static_configs:
      - targets: ["worker:3001"]
From these raw series, PromQL derives everything. The three queries I use daily:
# Request rate per route
sum(rate(http_request_duration_seconds_count[5m])) by (route)

# Error ratio (the number alerts are built on)
sum(rate(http_request_duration_seconds_count{status=~"5.."}[5m]))
  / sum(rate(http_request_duration_seconds_count[5m]))

# p95 latency
histogram_quantile(0.95,
  sum(rate(http_request_duration_seconds_bucket[5m])) by (le))
Grafana dashboards worth building
I build exactly two dashboards per service, and resist the urge to build more:
| Panel | Query basis | What it tells me |
|---|---|---|
| Request rate | rate(..._count[5m]) by route |
Traffic shape; sudden drops mean upstream breakage |
| Error ratio | 5xx rate / total rate | The single "are we OK?" number |
| Latency p50/p95/p99 | histogram_quantile |
User experience, tail included |
| Event-loop lag | nodejs_eventloop_lag_p99_seconds |
Blocked loop before it becomes latency |
| Heap used | nodejs_heap_size_used_bytes |
Leaks (drift) vs. normal sawtooth |
| DB pool in use | pool gauge vs. pool max | The bottleneck CPU graphs never show |
up per target |
up |
Is anything down right now |
The first dashboard is the overview: error ratio, p95, request rate, and up — the four panels I want on screen within ten seconds of an alert. The second is the runtime deep-dive: event-loop lag, heap, GC, pool saturation, per-route latency breakdown. During an incident you go overview → deep-dive, never the other way.
A rule that has served me well: if a panel hasn't influenced a decision in three months, delete it. Dashboards are for answering questions, not for looking impressive on a wall monitor.
Alerting without the noise
Alerting is where monitoring setups go to die. The failure mode is always the same: too many alerts, most of them false, until the team reflexively swipes them away — including the real one. My rules:
Alert on symptoms, not causes. Page on "error ratio above 2%" or "p95 above SLO", not on "CPU above 80%" or "memory above 70%". High CPU with happy users is a capacity planning note, not an emergency. Causes belong on dashboards for diagnosis; symptoms belong on pagers.
Use burn rates, not static thresholds. If my SLO allows a 1% error budget over 30 days, a static "errors > 1%" alert fires on every 90-second blip. A burn-rate alert instead asks how fast the budget is being consumed, with two windows so brief spikes don't page:
# alerts.yml
groups:
  - name: slo
    rules:
      - alert: HighErrorBurnRate
        expr: |
          (sum(rate(http_request_duration_seconds_count{status=~"5.."}[1h]))
            / sum(rate(http_request_duration_seconds_count[1h]))) > (14.4 * 0.01)
          and
          (sum(rate(http_request_duration_seconds_count{status=~"5.."}[5m]))
            / sum(rate(http_request_duration_seconds_count[5m]))) > (14.4 * 0.01)
        for: 2m
        labels: { severity: page }
        annotations:
          summary: "Burning 30-day error budget 14x too fast"
A 14.4x burn rate means the monthly budget would be gone in about two days — genuinely worth waking someone. Slower burns (say 3x over 6 hours) become tickets, not pages.
What I deliberately do NOT alert on: CPU, memory, or disk percentages on their own; a single pod restart the orchestrator already handled; p99 blips shorter than a few minutes; anything in staging; any cause-level metric that a symptom alert would catch anyway. Each of these has paged me pointlessly at some job or another. Every alert must pass one test: would a human need to act on this right now? If not, it's a dashboard panel or a ticket.
The whole stack in docker-compose
For local dev and small deployments the entire stack is three containers next to your app — same pattern as the monorepo Docker setup I use for app services:
services:
  api:
    build: ./apps/api
    ports: ["3000:3000"]

  prometheus:
    image: prom/prometheus:v2.53.0
    volumes:
      - ./ops/prometheus.yml:/etc/prometheus/prometheus.yml
      - ./ops/alerts.yml:/etc/prometheus/alerts.yml
      - prom-data:/prometheus
    ports: ["9090:9090"]

  grafana:
    image: grafana/grafana:11.1.0
    environment:
      - GF_SECURITY_ADMIN_PASSWORD=${GRAFANA_PASSWORD}
    volumes:
      - grafana-data:/var/lib/grafana
      - ./ops/grafana/provisioning:/etc/grafana/provisioning
    ports: ["3002:3000"]

volumes:
  prom-data:
  grafana-data:
Provision the Prometheus datasource and dashboards as JSON files under ops/grafana/provisioning so the whole observability stack is reproducible from a git clone — hand-clicked dashboards die with the container volume, and it always happens the week before you need them.
The honest cost accounting: this stack is roughly a day to set up properly, a couple hundred MB of RAM, and some ongoing discipline about cardinality and alert hygiene. What it buys is turning "the app feels slow" into "p95 on /orders doubled at 14:32 when pool saturation hit 100%" — a sentence that comes with its own fix attached.
Wrapping up
Monitoring is one of the highest-leverage things a backend engineer can set up, and one of the easiest to overdo. The version that works: RED metrics with honest percentiles, plus the Node vitals that fail early — event-loop lag, heap, pool saturation. One histogram with SLO-shaped buckets in a NestJS interceptor. Two dashboards, not ten. Alerts on symptoms with burn rates, and a short, principled list of things you refuse to be paged for.
Start with that, run it for a month, and let real incidents — not imagination — tell you what to add next. The goal isn't to graph everything; it's that when the pager goes off, it's real, and the graph that explains it is already open.
Working on something like this?
I take on backend, payments and deployment projects. I reply within one working day.