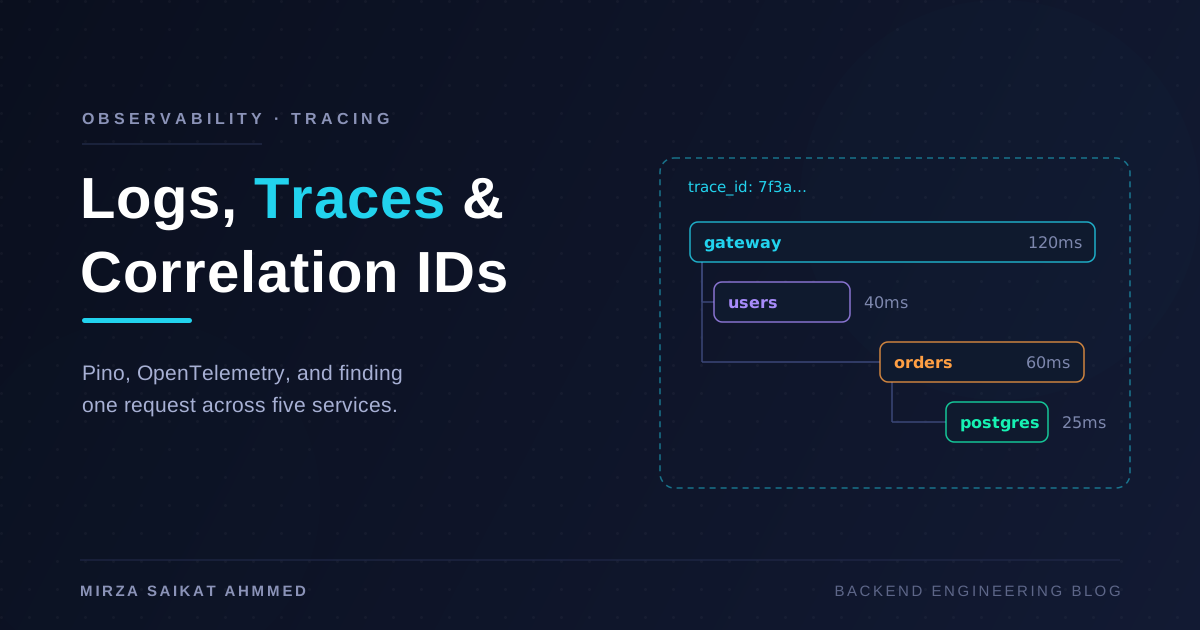
A user reports that checkout failed at 2:14 p.m. In a monolith, you grep one log file and you're done. In the microservices setup I described in my NestJS microservices post, that one click touched the gateway, the users service, the orders service, and Postgres — four processes, four log streams, and no built-in way to know which lines belong to the same request. The failure you're hunting is real, but the evidence is shredded across services.
Fixing that takes two upgrades, and they're worth doing in order. First, structured logging: logs become queryable JSON events instead of prose, with a correlation ID that follows the request everywhere. Second, distributed tracing: OpenTelemetry records the actual call tree with timings, so "which service was slow" becomes something you look up, not something you debate. Here's how I wire both into Node/NestJS services, and what it honestly costs.
Why console.log doesn't scale
console.log("user logged in " + userId) has three problems that only show up once you have real traffic:
- It's unqueryable. You can grep it, but you can't ask "show me all failed logins for this user in the last hour, grouped by service." Prose logs force you to write regexes against sentences that developers keep rephrasing.
- It's synchronous.
console.logto stdout can block the event loop under load. A chatty code path plus slow log draining equals mystery latency you'll never attribute correctly. - It has no context. The line says a user logged in. Which request? Which instance? What was upstream? By the time you need the answer, the context is gone.
Structured logging fixes this by treating every log line as an event with fields:
{"level":30,"time":1752924861123,"service":"orders","req_id":"7f3a1c","user_id":42,"msg":"order created","order_id":918,"duration_ms":34}
Ugly to human eyes, but machines love it — and in production, machines are the ones reading.
Pino and nestjs-pino
Pino is the fastest mainstream JSON logger for Node, largely because it does less: no formatting in-process, minimal serialization work, everything else deferred. With nestjs-pino it slots into NestJS as the app-wide logger and automatically logs every HTTP request:
// app.module.ts
import { LoggerModule } from 'nestjs-pino';
import { randomUUID } from 'crypto';

@Module({
  imports: [
    LoggerModule.forRoot({
      pinoHttp: {
        level: process.env.LOG_LEVEL ?? 'info',
        // Reuse the inbound ID so the chain stays connected; mint one at the edge
        genReqId: (req) => req.headers['x-request-id'] ?? randomUUID(),
        redact: ['req.headers.authorization', 'req.headers.cookie'],
        transport:
          process.env.NODE_ENV === 'development'
            ? { target: 'pino-pretty' } // pretty locally, raw JSON in prod
            : undefined,
      },
    }),
  ],
})
export class AppModule {}
// orders.service.ts
@Injectable()
export class OrdersService {
  constructor(@InjectPinoLogger(OrdersService.name) private readonly logger: PinoLogger) {}

  async create(dto: CreateOrderDto) {
    const order = await this.repo.save(dto);
    // Fields first, message second — this is the habit that pays off
    this.logger.info({ orderId: order.id, userId: dto.userId }, 'order created');
    return order;
  }
}
Two habits matter more than the library choice. Log fields, not sentences — { orderId: 918 }, 'order created' is queryable; `order ${id} created` is not. And redact secrets at the logger, because the day someone logs a whole request object, you want the authorization header already scrubbed.
Log levels, used honestly
Levels only help if they mean something. My contract:
fatal— the process is about to die.error— an operation failed and someone should eventually look. If nobody would ever act on it, it is not an error.warn— survivable weirdness: retry succeeded, fallback used, deprecated call seen.info— business events at the rate of roughly one to five per request. This is your production default.debug/trace— high-volume diagnostics, off in prod, flipped on per-service viaLOG_LEVELwhen hunting something.
The discipline part: if your error stream has entries nobody ever reads, downgrade them. An error level that cries wolf trains the team to ignore the stream entirely — the same failure mode as noisy alerting.
Correlation IDs across services
Within one process, the request ID needs to reach every log line without threading a reqId parameter through fifty function signatures. Node's AsyncLocalStorage solves this: it's a context store that follows the async call chain, so anything triggered by a request can read that request's context.
// request-context.ts
import { AsyncLocalStorage } from 'async_hooks';

export const requestContext = new AsyncLocalStorage<{ reqId: string }>();

// middleware — wrap every request in its own context
export function contextMiddleware(req, res, next) {
  const reqId = (req.headers['x-request-id'] as string) ?? randomUUID();
  res.setHeader('x-request-id', reqId);
  requestContext.run({ reqId }, next);
}
nestjs-pino does this internally, which is why every logger.info inside a request automatically carries req_id. The part you own is propagation: when service A calls service B, the outbound request must carry x-request-id forward, and B's genReqId must reuse it rather than minting a fresh one. Do that everywhere, and one grep — req_id:"7f3a1c" in your log aggregator — returns the interleaved story of a single request across every service it touched.
That alone resolves maybe half of cross-service mysteries. The other half need timings and structure, which is where tracing comes in.
From logs to traces: OpenTelemetry
A trace is the tree of everything one request caused, where each node — a span — records an operation with a start time, duration, attributes, and a parent. Logs tell you what happened; a trace shows you the shape and cost of it: the gateway span containing a users-service span and an orders-service span, the orders span containing a 25ms Postgres query. "Why was this request slow" becomes a waterfall you read in seconds.
OpenTelemetry (OTel) is the vendor-neutral standard for producing them, and its killer feature in Node is auto-instrumentation: it patches http, Express/Fastify, pg, ioredis, and friends so you get spans for every inbound request, outbound call, DB query, and cache hit without touching application code. The setup lives in one file that must load before anything else:
// tracing.ts — import this first in main.ts
import { NodeSDK } from '@opentelemetry/sdk-node';
import { getNodeAutoInstrumentations } from '@opentelemetry/auto-instrumentations-node';
import { OTLPTraceExporter } from '@opentelemetry/exporter-trace-otlp-http';
import { TraceIdRatioBasedSampler, ParentBasedSampler } from '@opentelemetry/sdk-trace-base';

const sdk = new NodeSDK({
  serviceName: process.env.OTEL_SERVICE_NAME ?? 'orders',
  traceExporter: new OTLPTraceExporter({
    url: process.env.OTEL_EXPORTER_OTLP_ENDPOINT ?? 'http://tempo:4318/v1/traces',
  }),
  sampler: new ParentBasedSampler({
    root: new TraceIdRatioBasedSampler(0.1), // keep 10% of traces
  }),
  instrumentations: [getNodeAutoInstrumentations()],
});

sdk.start();
Auto-instrumentation also handles context propagation: outbound HTTP calls get a traceparent header carrying the trace ID and parent span ID, and the receiving service's instrumentation continues the same trace. It's the correlation-ID pattern, standardized and automatic. (This works across gRPC hops too — relevant if you've read my HTTP vs gRPC comparison — via gRPC metadata instead of headers.)
Where auto-instrumentation gives you the skeleton, custom spans add the business meaning:
import { trace } from '@opentelemetry/api';

const tracer = trace.getTracer('orders');

async chargeCard(order: Order) {
  return tracer.startActiveSpan('payment.charge', async (span) => {
    span.setAttribute('order.id', order.id);
    span.setAttribute('payment.amount_cents', order.totalCents);
    try {
      return await this.paymentGateway.charge(order);
    } catch (err) {
      span.recordException(err);
      throw err;
    } finally {
      span.end();
    }
  });
}
Export goes to Jaeger (simple, great UI, my default for dev) or Grafana Tempo (object-storage backend, cheap at volume, pairs with the Grafana stack) — both speak OTLP, so switching is a URL change. Locally I run Jaeger as one container in the same compose file as the rest of the stack:
  jaeger:
    image: jaegertracing/all-in-one:1.58
    ports:
      - "16686:16686"   # UI
      - "4318:4318"     # OTLP HTTP ingest
Connecting logs and traces
The real payoff comes from stitching the two systems together with one field: put the active trace_id on every log line.
// in the pino config
mixin() {
  const span = trace.getActiveSpan();
  if (!span) return {};
  const { traceId, spanId } = span.spanContext();
  return { trace_id: traceId, span_id: spanId };
},
Now the workflows compose: an error log in Loki or Elasticsearch carries a trace_id you click to open the exact waterfall in Jaeger; a slow trace's ID pastes into log search to reveal every log line from that specific request across all services. Neither signal alone tells the full story — an error log without the trace lacks shape; a trace without logs lacks the why.
For the record, the three signals and their jobs:
| Logs | Metrics | Traces | |
|---|---|---|---|
| Answers | What happened, in detail | Is the system healthy, in aggregate | Where one request spent its time |
| Shape | Discrete events with fields | Numeric time series | Trees of timed spans |
| Cost driver | Volume (per event) | Cardinality (per series) | Volume × retention (per span) |
| Aggregation | Poor — needle-finding tool | Excellent — trend tool | Per-request — shape tool |
| Alert on it? | Rarely | Yes — this is what alerting is for | No — diagnose with it |
| Typical store | Loki, Elasticsearch | Prometheus | Jaeger, Tempo |
Sampling and cost control
Nobody stores every trace, and you shouldn't try. At even modest traffic, 100% tracing means gigabytes per day of spans — most of them recording successful 40ms requests that nobody will ever look at. The TraceIdRatioBasedSampler above keeps a fixed fraction (10% is a sane start), and ParentBasedSampler ensures the decision is made once at the root and honored downstream — otherwise you get shredded partial traces, the worst of both worlds.
The known weakness of head sampling: the decision is made before knowing how the request ends, so 90% of your errors are discarded along with 90% of the boring successes. Tail-based sampling — buffering spans in an OTel Collector and keeping traces that erred or ran slow — fixes exactly that, at the price of running and sizing a Collector. My honest recommendation: start with head sampling at 10%, and reach for tail sampling only when you find yourself repeatedly missing the trace for the error you're debugging. Logs cost money too — sample or drop debug noise at the aggregator, and keep info lean per request rather than narrating every function call.
Wrapping up
Observability for a distributed backend comes down to three moves, in order of effort-to-payoff. Structured JSON logs with Pino — an afternoon of work, and your logs become a database instead of a novel. Correlation IDs propagated across every hop — a middleware and a header, and one ID reassembles any request's story. OpenTelemetry tracing — a day of setup with auto-instrumentation, and cross-service latency stops being a guessing game.
Then link them: trace_id on every log line, sampling tuned to what you can afford to store. The test of the whole setup is a single question — "show me everything about the request that failed at 2:14 p.m." If answering it takes one search and two clicks, the system works. If it takes four terminals and a war-room channel, you've felt exactly the pain this stack exists to remove.
Working on something like this?
I take on backend, payments and deployment projects. I reply within one working day.