The slowest endpoint I ever debugged wasn't slow because of a bad algorithm or a missing cache. It was a plain "list orders" endpoint that ran 101 queries to render one page. The code looked innocent — a loop, a property access, nothing that screamed "database" at all. That's the defining feature of ORM performance traps: the ORM's whole job is to hide SQL from you, and it hides the bad SQL just as well as the good.
I still use ORMs on almost every project. TypeORM and Prisma save me an enormous amount of boilerplate, and 90% of queries in a typical NestJS service are simple enough that the ORM's output is exactly what I'd write by hand. But the other 10% is where all the latency lives, and finding it requires knowing what the ORM is doing behind your back. This post is the checklist I wish someone had handed me: N+1 in detail, then the quieter traps — hydration cost, invisible missing indexes, implicit transactions, cartesian explosions, and pagination done wrong.
What N+1 actually is
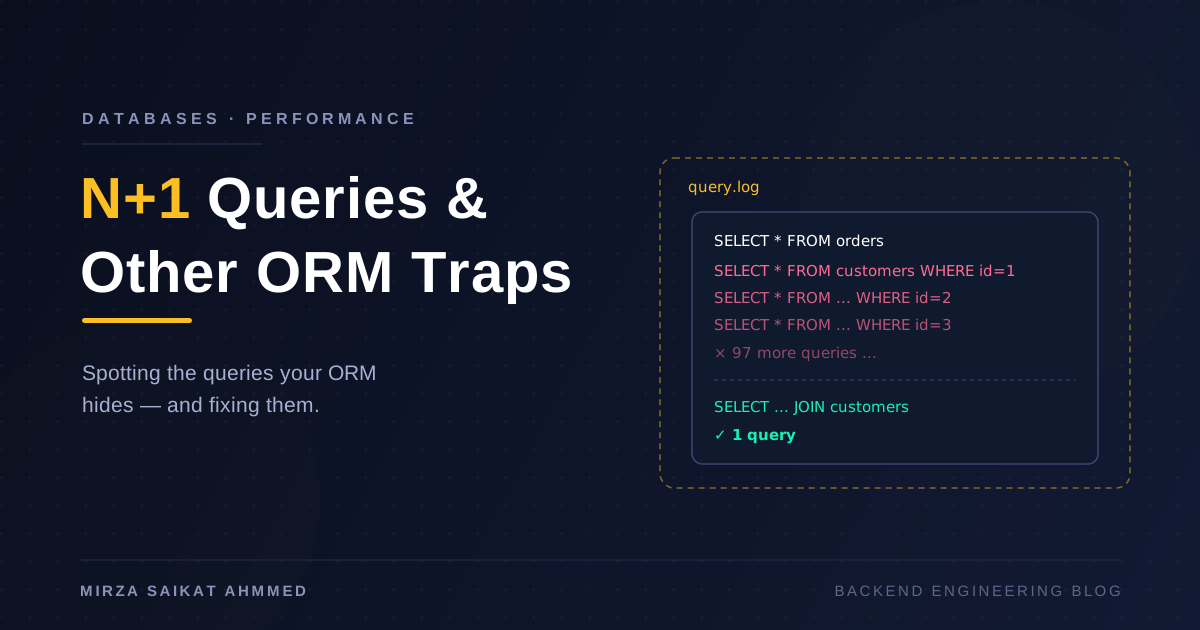
You load a list of N rows (1 query), then access a relation on each row, and the ORM lazily fires one query per row (N more). Load 100 orders, touch order.customer, get 101 round trips:
// Looks innocent. Runs 101 queries.
const orders = await this.ordersRepo.find({ take: 100 });

return orders.map((order) => ({
  id: order.id,
  total: order.total,
  customerName: order.customer.name, // lazy relation → 1 query per order
}));
The log tells the real story:
SELECT * FROM orders LIMIT 100;
SELECT * FROM customers WHERE id = 1;
SELECT * FROM customers WHERE id = 2;
SELECT * FROM customers WHERE id = 3;
-- ... 97 more identical queries
The insidious part is that each query is fast — 1–2ms, no slow-query alert will ever fire. But 100 sequential round trips at 1.5ms each is 150ms of pure network latency doing work one JOIN does in 5ms. And it scales with data, not code: the endpoint that was fine at 20 orders in staging is 5x slower at 100 orders in production, and nobody changed anything.
Prisma's lazy-loading flavor looks different but ends the same place:
const orders = await prisma.order.findMany({ take: 100 });
for (const order of orders) {
  // findUnique inside a loop — same 101 queries, just more explicit
  const customer = await prisma.customer.findUnique({
    where: { id: order.customerId },
  });
}
How to spot it
You can't fix what you can't see, and the entire problem is that the ORM makes queries invisible. Two habits fix that.
Turn on query logging in development. Non-negotiable on my teams:
// TypeORM (data-source.ts)
export const dataSource = new DataSource({
  type: 'postgres',
  logging: ['query'],
  maxQueryExecutionTime: 100, // separately flag anything over 100ms
  // ...
});

// Prisma
const prisma = new PrismaClient({
  log: [{ emit: 'event', level: 'query' }],
});
prisma.$on('query', (e) => logger.debug(`${e.duration}ms ${e.query}`));
Then actually watch it. A scrolling wall of near-identical WHERE id = $1 queries during one request is N+1 announcing itself. I've caught more performance bugs by leaving query logs on while clicking through the app than with any profiler.
Count queries per request in production. APM tools (Datadog, Sentry, OpenTelemetry instrumentation) group DB spans per trace — sort endpoints by span count, not just duration. In one service I added a crude middleware counter that tagged responses with X-DB-Queries in staging; any endpoint over ~10 queries got a ticket. Crude, effective.
Fixing N+1
Fix 1: ask for the relation upfront. Both ORMs make the right thing easy once you know to ask:
// TypeORM — LEFT JOINs customers in one query
const orders = await this.ordersRepo.find({
  take: 100,
  relations: { customer: true },
});

// Prisma — batches into 2 queries: orders, then customers WHERE id IN (...)
const orders = await prisma.order.findMany({
  take: 100,
  include: { customer: true },
});
Note they use different strategies: TypeORM joins by default, Prisma issues a second WHERE id IN (...) query. Two queries instead of one join is still perfectly fine — it's 2 round trips, not 101 — and it sidesteps the cartesian problem below. TypeORM can do the same via relationLoadStrategy: "query".
Fix 2: the dataloader pattern for GraphQL or anywhere the accesses are scattered across resolvers and you can't centralize the include. A dataloader collects all the customer IDs requested in one tick of the event loop and issues a single batched query:
@Injectable({ scope: Scope.REQUEST })
export class CustomerLoader {
  readonly loader = new DataLoader<string, Customer>(async (ids) => {
    const rows = await this.customersRepo.findBy({ id: In([...ids]) });
    const byId = new Map(rows.map((c) => [c.id, c]));
    return ids.map((id) => byId.get(id)!);
  });
}
Request-scoped so the cache doesn't leak between users. This is the standard fix for N+1 in NestJS GraphQL apps, and it composes: nested resolvers all hit the same batch.
The other traps
N+1 gets all the blog posts, but these four have cost me just as much real latency.
SELECT * and hydration cost. ORMs select every column and instantiate a full entity object per row. Fetch 5,000 rows with a text column holding 50KB JSON blobs and you're moving hundreds of MB and burning CPU turning it into class instances — to render a list that needed id and title. Both ORMs can select narrowly (select: { id: true, title: true } in Prisma, select: ['id', 'title'] in TypeORM); for hot read paths I skip entity hydration entirely with .getRawMany(). The difference on wide tables is not subtle — I've seen 10x on both latency and memory.
Missing indexes behind the abstraction. When you write SQL by hand, the WHERE clause stares at you and you think about indexes. When a repository method generates it, you don't. Every foreign key you join or filter on needs an index, and ORMs do not create indexes on FK columns for you (Postgres doesn't either — only unique constraints get one). My routine: pull the top queries from pg_stat_statements, EXPLAIN ANALYZE anything over a few ms, and look for Seq Scan on big tables. The ORM decorator fix is one line — @Index() on the column, or @@index([customerId]) in the Prisma schema — the hard part is remembering the ORM won't do it for you.
Implicit transaction behavior. TypeORM's save() on an entity with cascaded relations runs multiple statements inside a transaction it opens for you; Prisma's nested writes do the same. Fine — until you make an HTTP call between two writes you assumed were atomic and discover they're separate transactions, or hold a transaction open across a slow external call and starve the pool. Every write path that must be atomic gets an explicit transaction boundary in my code, for the same reasons I covered in payment idempotency and transactions: correctness you can point at beats correctness you assume.
Cartesian explosion with multiple joins. Join one order to 10 items and 5 shipments in a single query and SQL gives you 50 rows for that order — every item × every shipment. TypeORM's join strategy deduplicates this back into entities, but the database still produced, sorted, and shipped 50x the rows; with three or four one-to-many relations, a 100-order query can quietly materialize hundreds of thousands of intermediate rows. This is exactly why Prisma defaults to separate IN queries per relation. The fix in TypeORM: split the load — fetch orders, then load each collection with its own IN query (relationLoadStrategy: "query" does this for you).
Pagination done wrong. skip/take compiles to OFFSET, and OFFSET 100000 makes Postgres fetch and discard 100,000 rows before returning your 20. Page 1 is fast, page 5,000 times out, and ORMs make the slow version the ergonomic default. Keyset (cursor) pagination stays flat forever:
-- Offset: reads and throws away 100,000 rows
SELECT * FROM orders ORDER BY created_at DESC OFFSET 100000 LIMIT 20;

-- Keyset: seeks straight to the boundary via the index
SELECT * FROM orders
WHERE (created_at, id) < ($1, $2)   -- cursor from the previous page
ORDER BY created_at DESC, id DESC
LIMIT 20;
Prisma supports this natively (cursor), TypeORM needs a hand-written WHERE. The trade-off is honest: you lose "jump to page 47." For infinite scroll and API pagination — which is most pagination — you never needed it.
The fixes at a glance
| Trap | Symptom | Fix | Cost of the fix |
|---|---|---|---|
| N+1 queries | Dozens of identical WHERE id = $1 per request |
relations / include, dataloader |
Must know your access pattern upfront |
| Cartesian explosion | One query, huge row count, high DB CPU | Split into per-relation IN queries |
More round trips (usually worth it) |
| SELECT * hydration | High memory, slow wide-table reads | Narrow select, raw results on hot paths |
Lose typed entities on raw paths |
| Missing FK indexes | Seq Scan in EXPLAIN, degrades as data grows |
@Index() / @@index, check pg_stat_statements |
Slightly slower writes per index |
| Implicit transactions | Partial writes, pool exhaustion | Explicit transaction boundaries | More verbose write code |
| Offset pagination | Deep pages time out | Keyset/cursor pagination | No random page access |
When to drop to raw SQL
My rule: the ORM owns CRUD and simple relations; raw SQL owns reporting, aggregation, and anything where I've had to fight the query builder for more than twenty minutes. A dashboard query with window functions, FILTER clauses, and a lateral join is clearer in SQL than in any builder DSL — and both ORMs make the escape hatch safe and parameterized:
// Prisma
const rows = await prisma.$queryRaw<RevenueRow[]>`
  SELECT date_trunc('day', created_at) AS day,
         sum(total) AS revenue,
         count(*) FILTER (WHERE status = 'refunded') AS refunds
  FROM orders
  WHERE created_at >= ${since}
  GROUP BY 1 ORDER BY 1
`;
Dropping to SQL isn't admitting defeat; treating the ORM as a hard boundary is how you end up with six chained query-builder calls emulating one GROUP BY. In larger service architectures I keep these raw queries collected in repository classes so the SQL surface stays auditable — the ORM and raw SQL coexist behind the same interface.
Wrapping up
None of these traps are bugs in TypeORM or Prisma. They're the price of an abstraction that maps object access onto a network protocol: property access looks free but might cost a round trip, defaults favor convenience over throughput, and the SQL that actually runs is out of sight. The engineers who get burned aren't the ones using ORMs — they're the ones using ORMs without ever looking at the queries.
So look. Query logging on in development, span counts in APM, EXPLAIN ANALYZE on anything suspicious, and a healthy reflex of asking "how many queries did that just run?" after writing a loop. The ORM is a fine servant and a terrible master — keep reading its SQL, and it stays the former.
Working on something like this?
I take on backend, payments and deployment projects. I reply within one working day.